
LAKE TRANSPARENCY TRENDS
GRAPH / ANALYSIS SOURCES: MINNESOTA POLLUTION CONTROL AGENCY
These figures show water clarity over time on Pokegama Lake. The trend analysis was performed with a Seasonal Mann Kendall test. This statistical test detects changes in water clarity over time by comparing months across. For lakes with enough data, the figures include a trend line, which shows the direction of detected changes in water clarity. The gray area around the trend line represents the range where the actual clarity measure will fall with 95% certainty.
For years 1975 to 2021 there is no identifiable water clarity trend at this location. For the most recent year of the analysis, median water clarity was 0.99 feet higher than the watershed median.
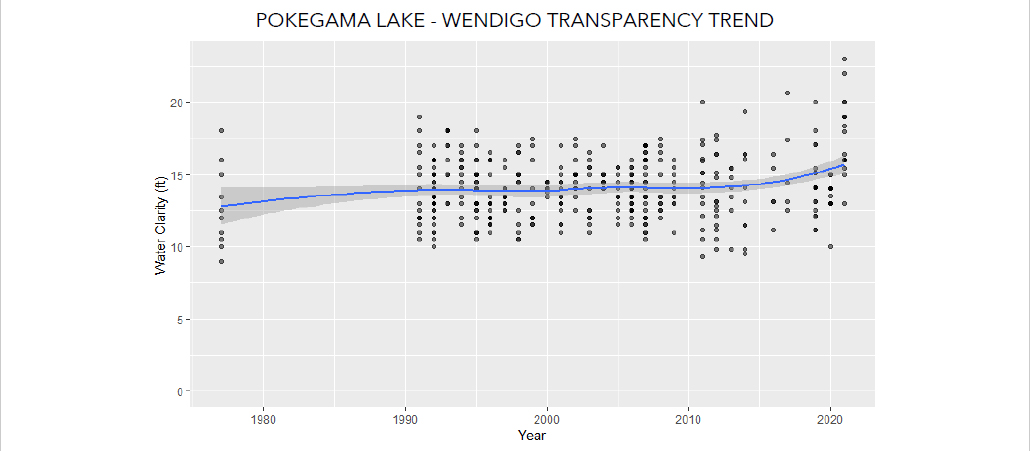
For years 1977 to 2021 there is evidence of no change in water clarity at this location. For the most recent year of the analysis, median water clarity was 2.40 feet higher than the watershed median.